Java VM Probe
Monitor Your Java Program Without
Making Code Changes!
The Java VM Probe has been designed
around the following concepts:
1. Non Invasive. This means that the probe will not require the you to change any of your source code. Additionally, you will not be required to recompile any of your code or include any frameworks that require your code to be recompiled. By simply specifying an additional command line option, you can make any Java program eligible to be monitored.
2. Light Weight. The probe monitoring environment has a small footprint. It will not require any heavy weight components such as a web server or application server.
3. Minimal Overhead. The probe has a minimal impact on the JVM that it is monitoring. It will ensure that it does not impact the monitored JVM by excessively competing for CPU or Memory. It will not interact with the monitored application in any way that would have an adverse impact on the application running within the monitored JVM.
4. Portable. The probe will not make any use of native code that would preclude it from running in a particular OS environment. While there are additional features for Windows OS’s, this does not preclude it from running on other OS’s. It will run on any 1.5 or later JVM.
5. Automatic Probe Discovery. The probe client user interface will detect and allow selection of an active probe using an automatic discovery. This means that active probes will “broadcast” their presence. The client UI will receive these broadcast requests from the network subnet and allow the user to connect to a specific probe.
6. Secure. When a client connects to a probe on another machine, the client user interface will restrict any command that can have an impact on that JVM. Additionally, the user id of the probe JVM must be specified and optionally, can be password secured to prevent unauthorized access.
7. Self Contained. All of the probes’ required classes, properties and resources will be packaged into a single Java Jar file. The same Jar file will be used for both the probe agent and the client UI. The Jar file’s manifest will contain the necessary information to launch either the probe agent or client UI.
The
Java VM Probe is easy to use, to specify a program to
monitor, add the –javaagent parameter to the java
command. Here is an example: java
–javaagent:<Path>JProbe.jar=<title> –cp myclasspath
com.my.main.class
This
will load the probe agent and allow you to monitor the operation of your
program. You can then launch the monitor UI by entering:
java
–jar <Path>JProbe.jar
When
the program starts, it will show a connect dialog such as this:
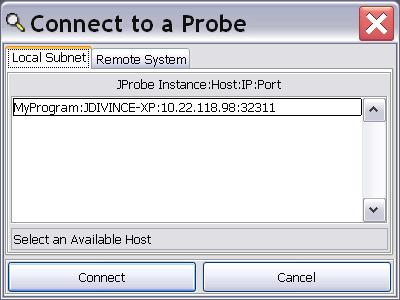
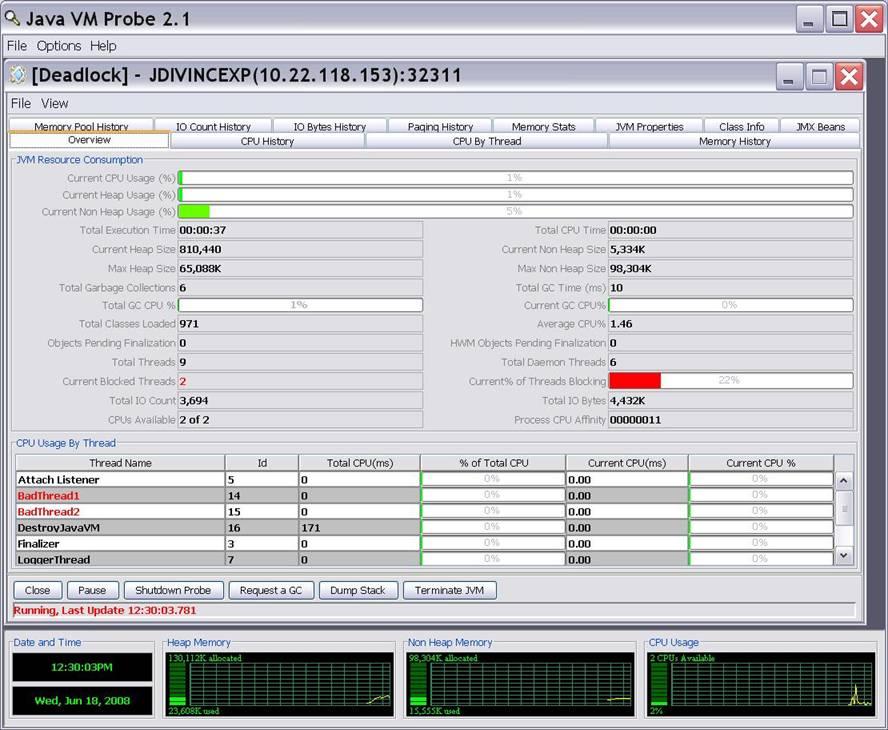
When
you select a probe, it will display the Overview Screen:
So, what are you waiting for, check
it out at http://sourceforge.net/projects/javavmprobe/